API Monitoring
API monitors send a configurable HTTP request to an endpoint every 30 seconds and alert you when it is unreachable, slow, or returns the wrong data. You control the method, headers, body and auth, and assert on the status code, JSON body, headers and response time.
Similar to other monitors, if an API monitor identifies an issue, you can work with your team to resolve the incident and optionally update your status page.
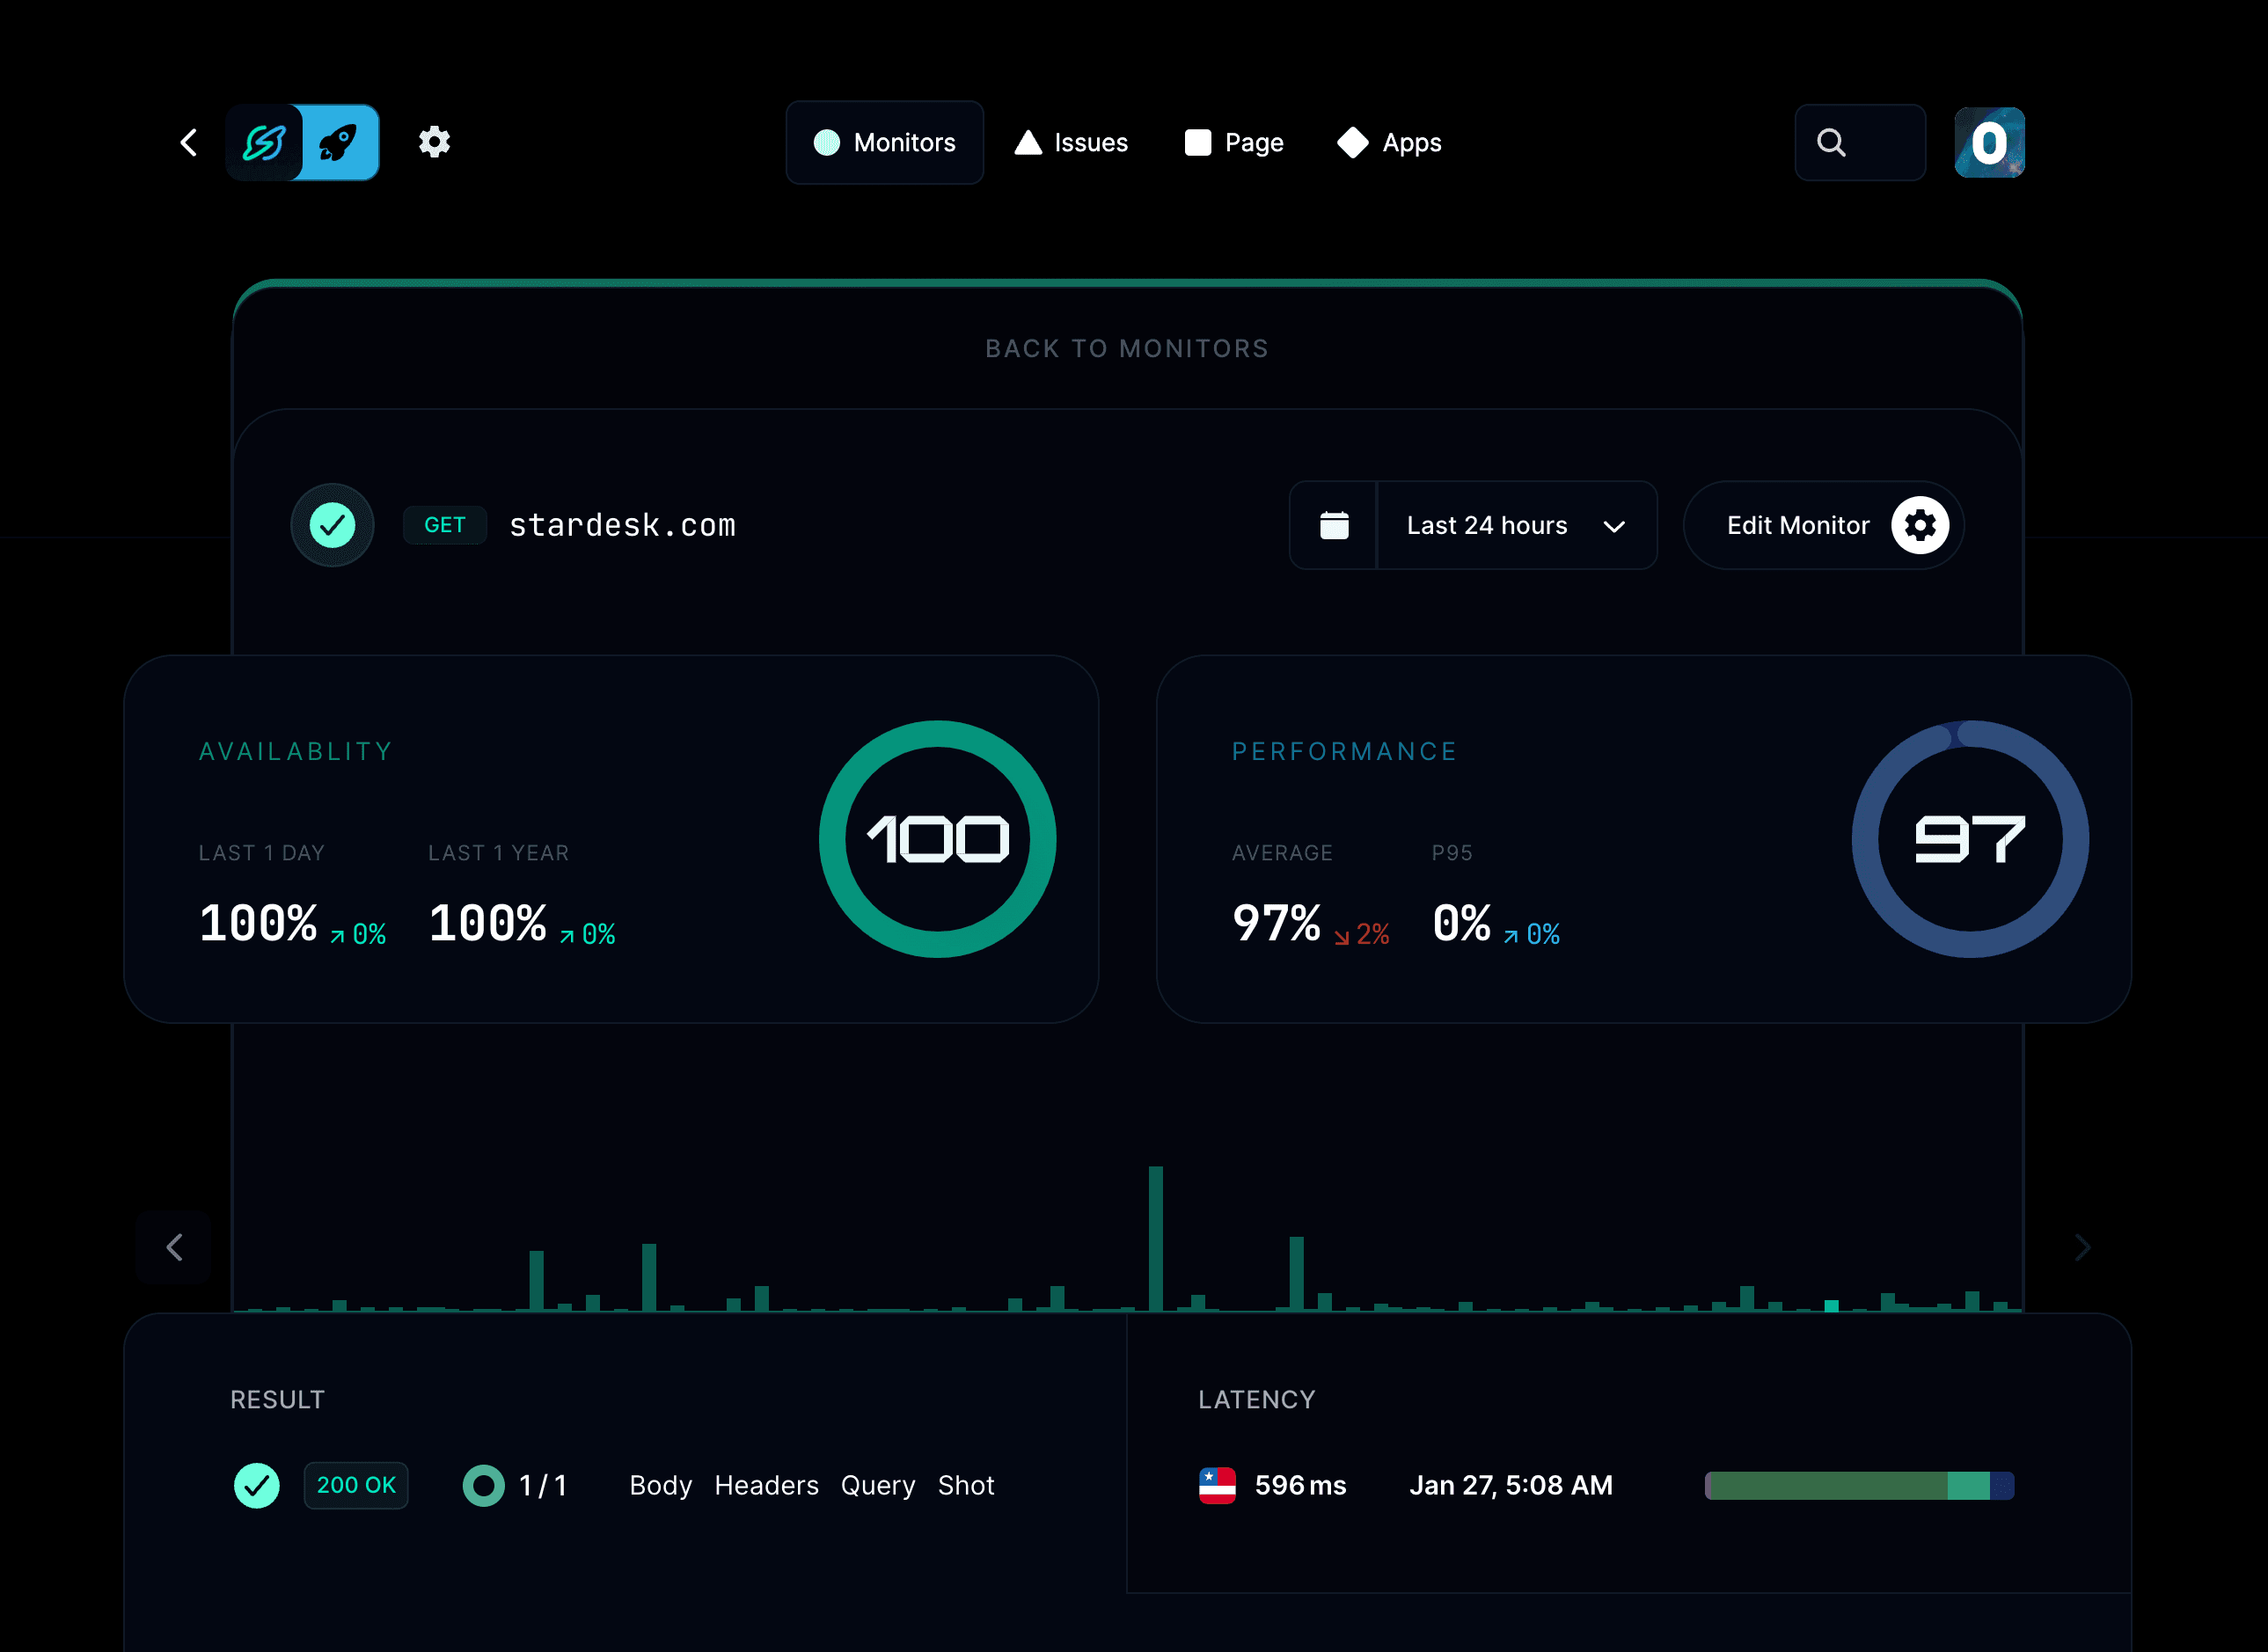
What does an API monitor check?
- Test your API endpoints from various global locations every 30 seconds.
- Validate HTTP status codes, JSON body, headers, and response times.
- Include custom headers, query parameters, or JSON payloads.
- Receive immediate notifications if an endpoint is down, slow, or returning unexpected results.
- Integrate with Slack, email, SMS, phone calls, webhooks, and more.
How do I add an API monitor?
Go to your project → Monitors → Add monitor, choose API, enter the endpoint URL, configure the request and set the assertions that mean the endpoint is healthy.
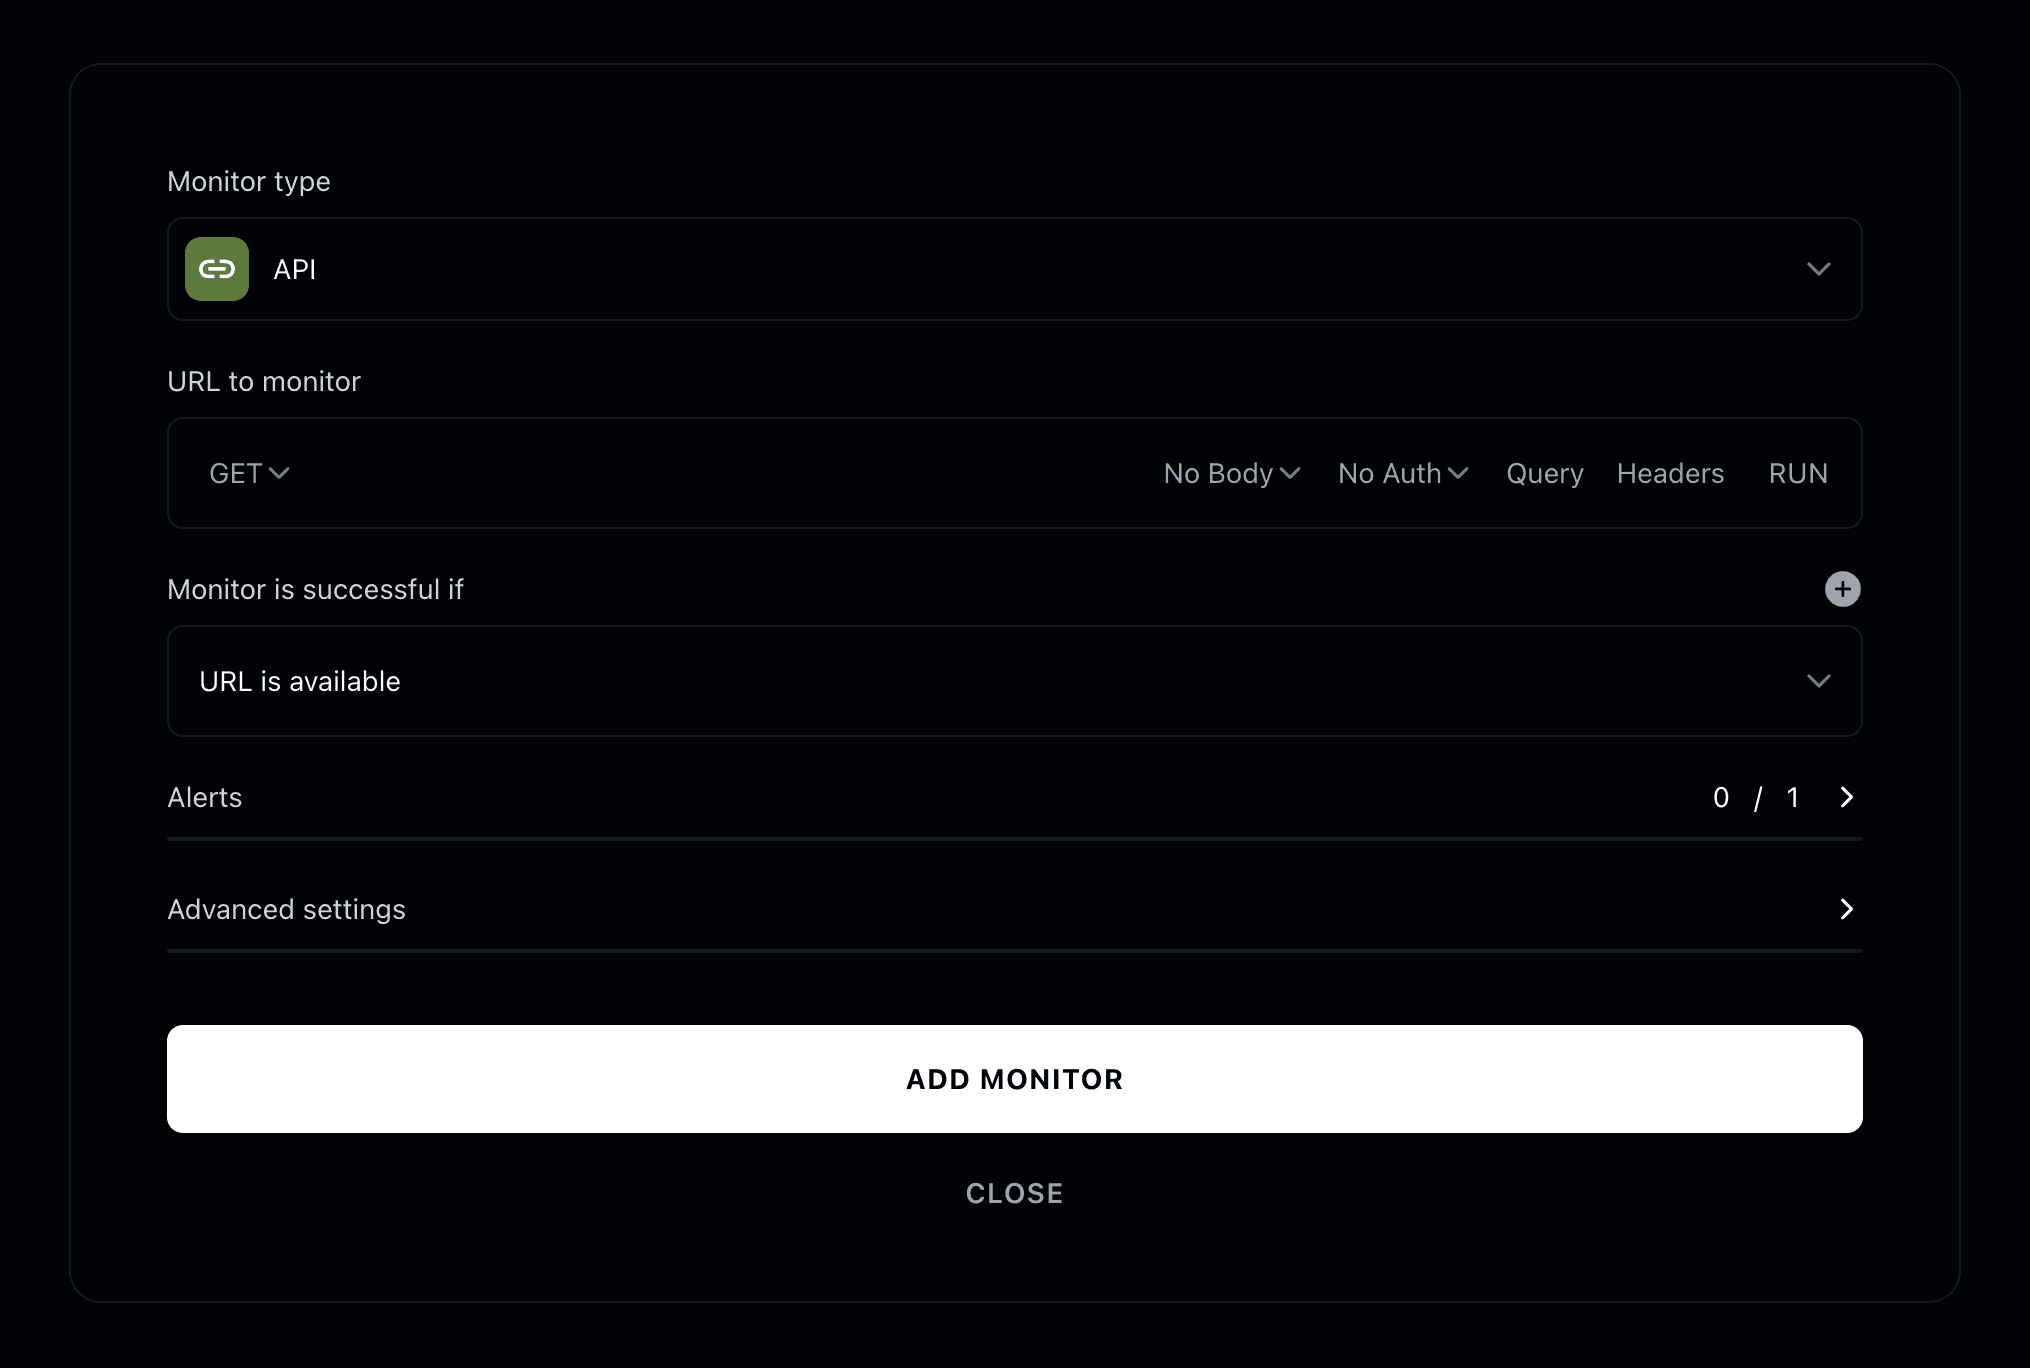
Monitor type
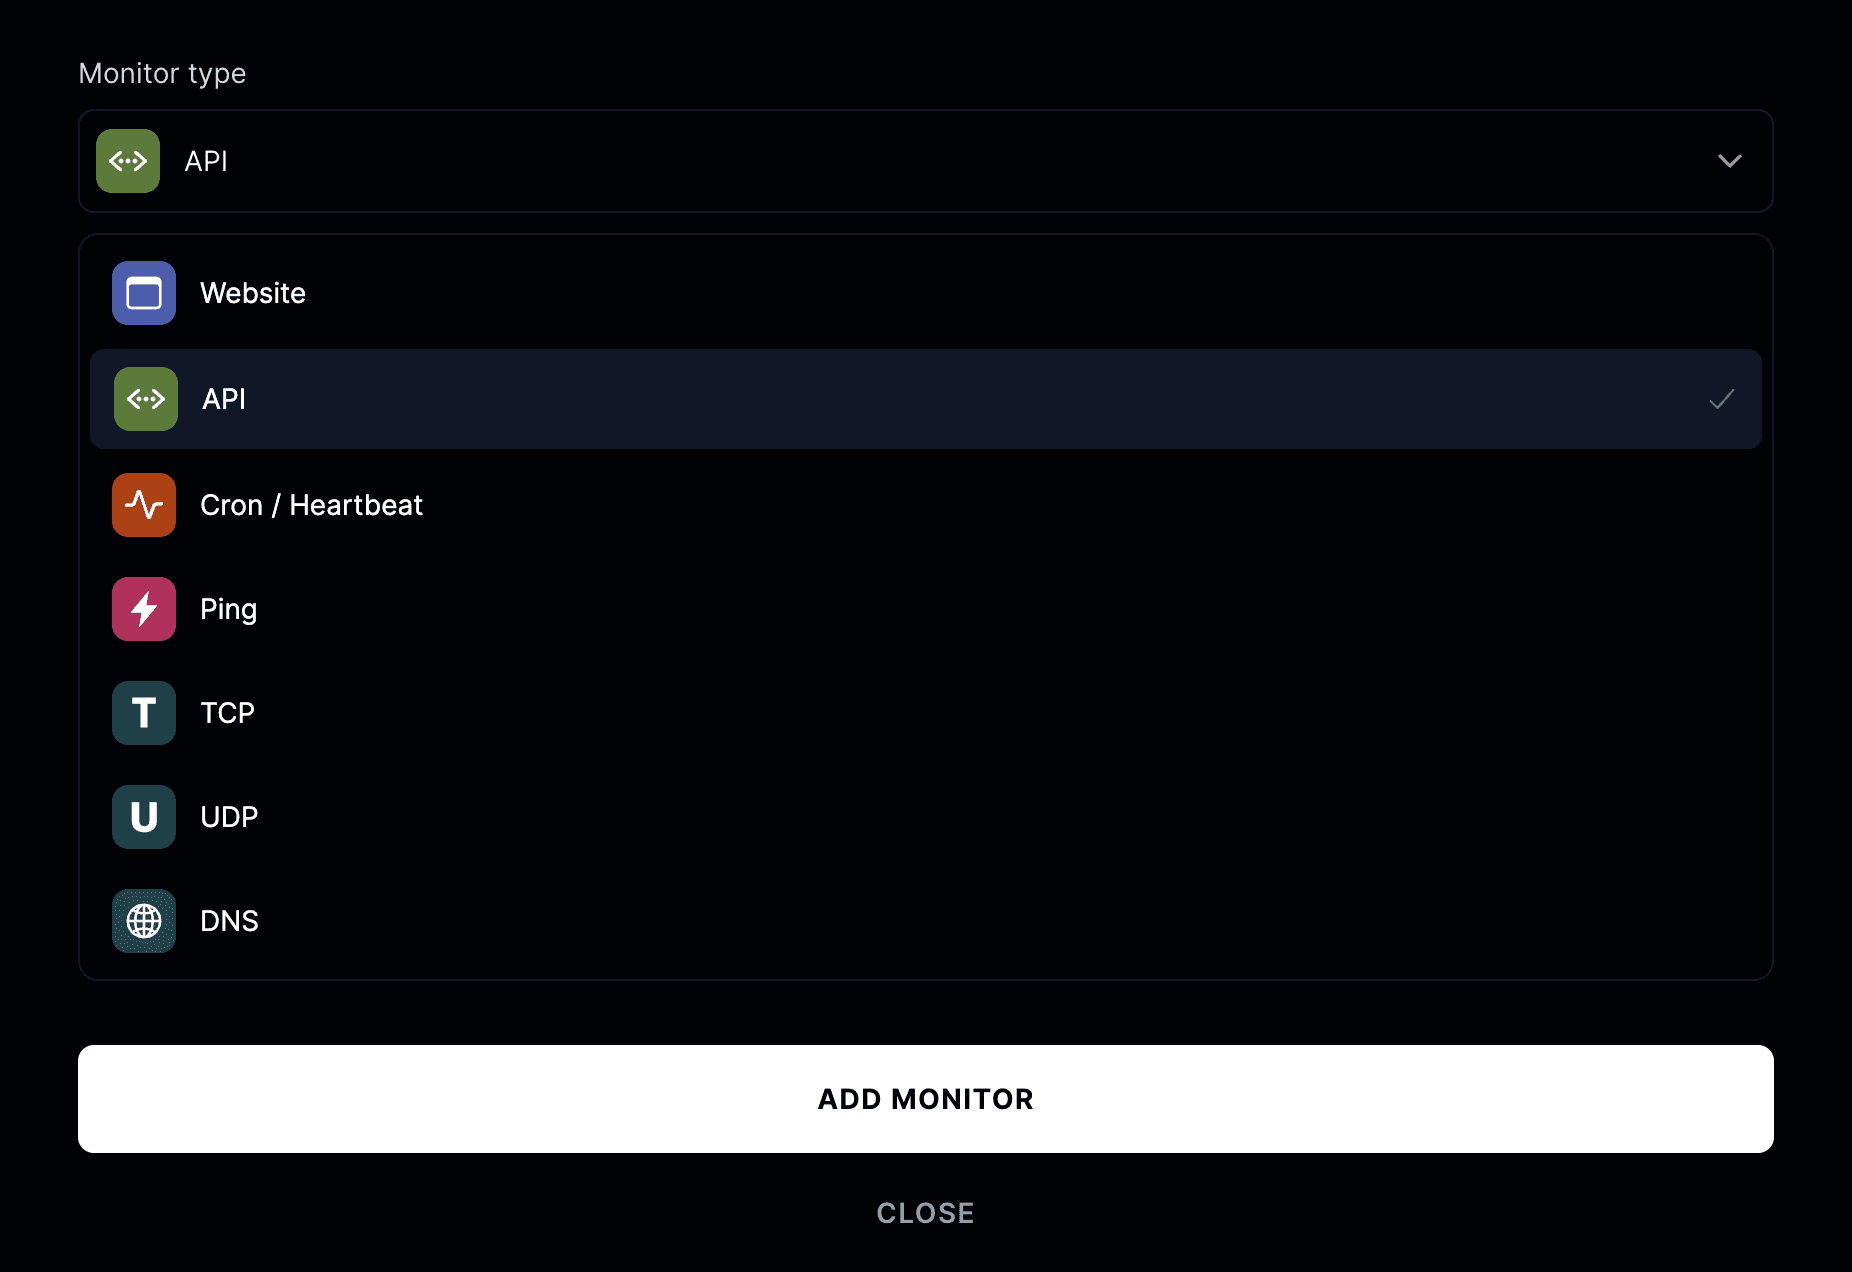
Choose API as the monitor type.
Input the endpoint URL you want to monitor — for example,
https://api.yourservice.com/v1/users.
Request configuration
You can fully tailor your API request:
- HTTP method:
GET,POST,PUT,PATCH,DELETE,OPTIONS, orHEAD - Body: Send JSON, form data, GraphQL, or plain text with your request
- Auth: Add basic authentication, API key, or Bearer token authorization
- Query parameters: Append key/value pairs to your request URL
- Headers: Add custom headers required for your API request
Monitor is successful if
An API monitor is successful when all specified assertions are satisfied.
You can set one or more of the following assertions:
- Status code: e.g. response is
200 OK - Response time: e.g. under
1 second - Body contains: e.g.
"success": true - JSON path: e.g.
data.statusequals"active" - Header contains: e.g.
Content-Type: application/json
If any of these conditions are not met, the monitor will be marked as down, and alerts will be sent based on your alert settings.
Advanced settings
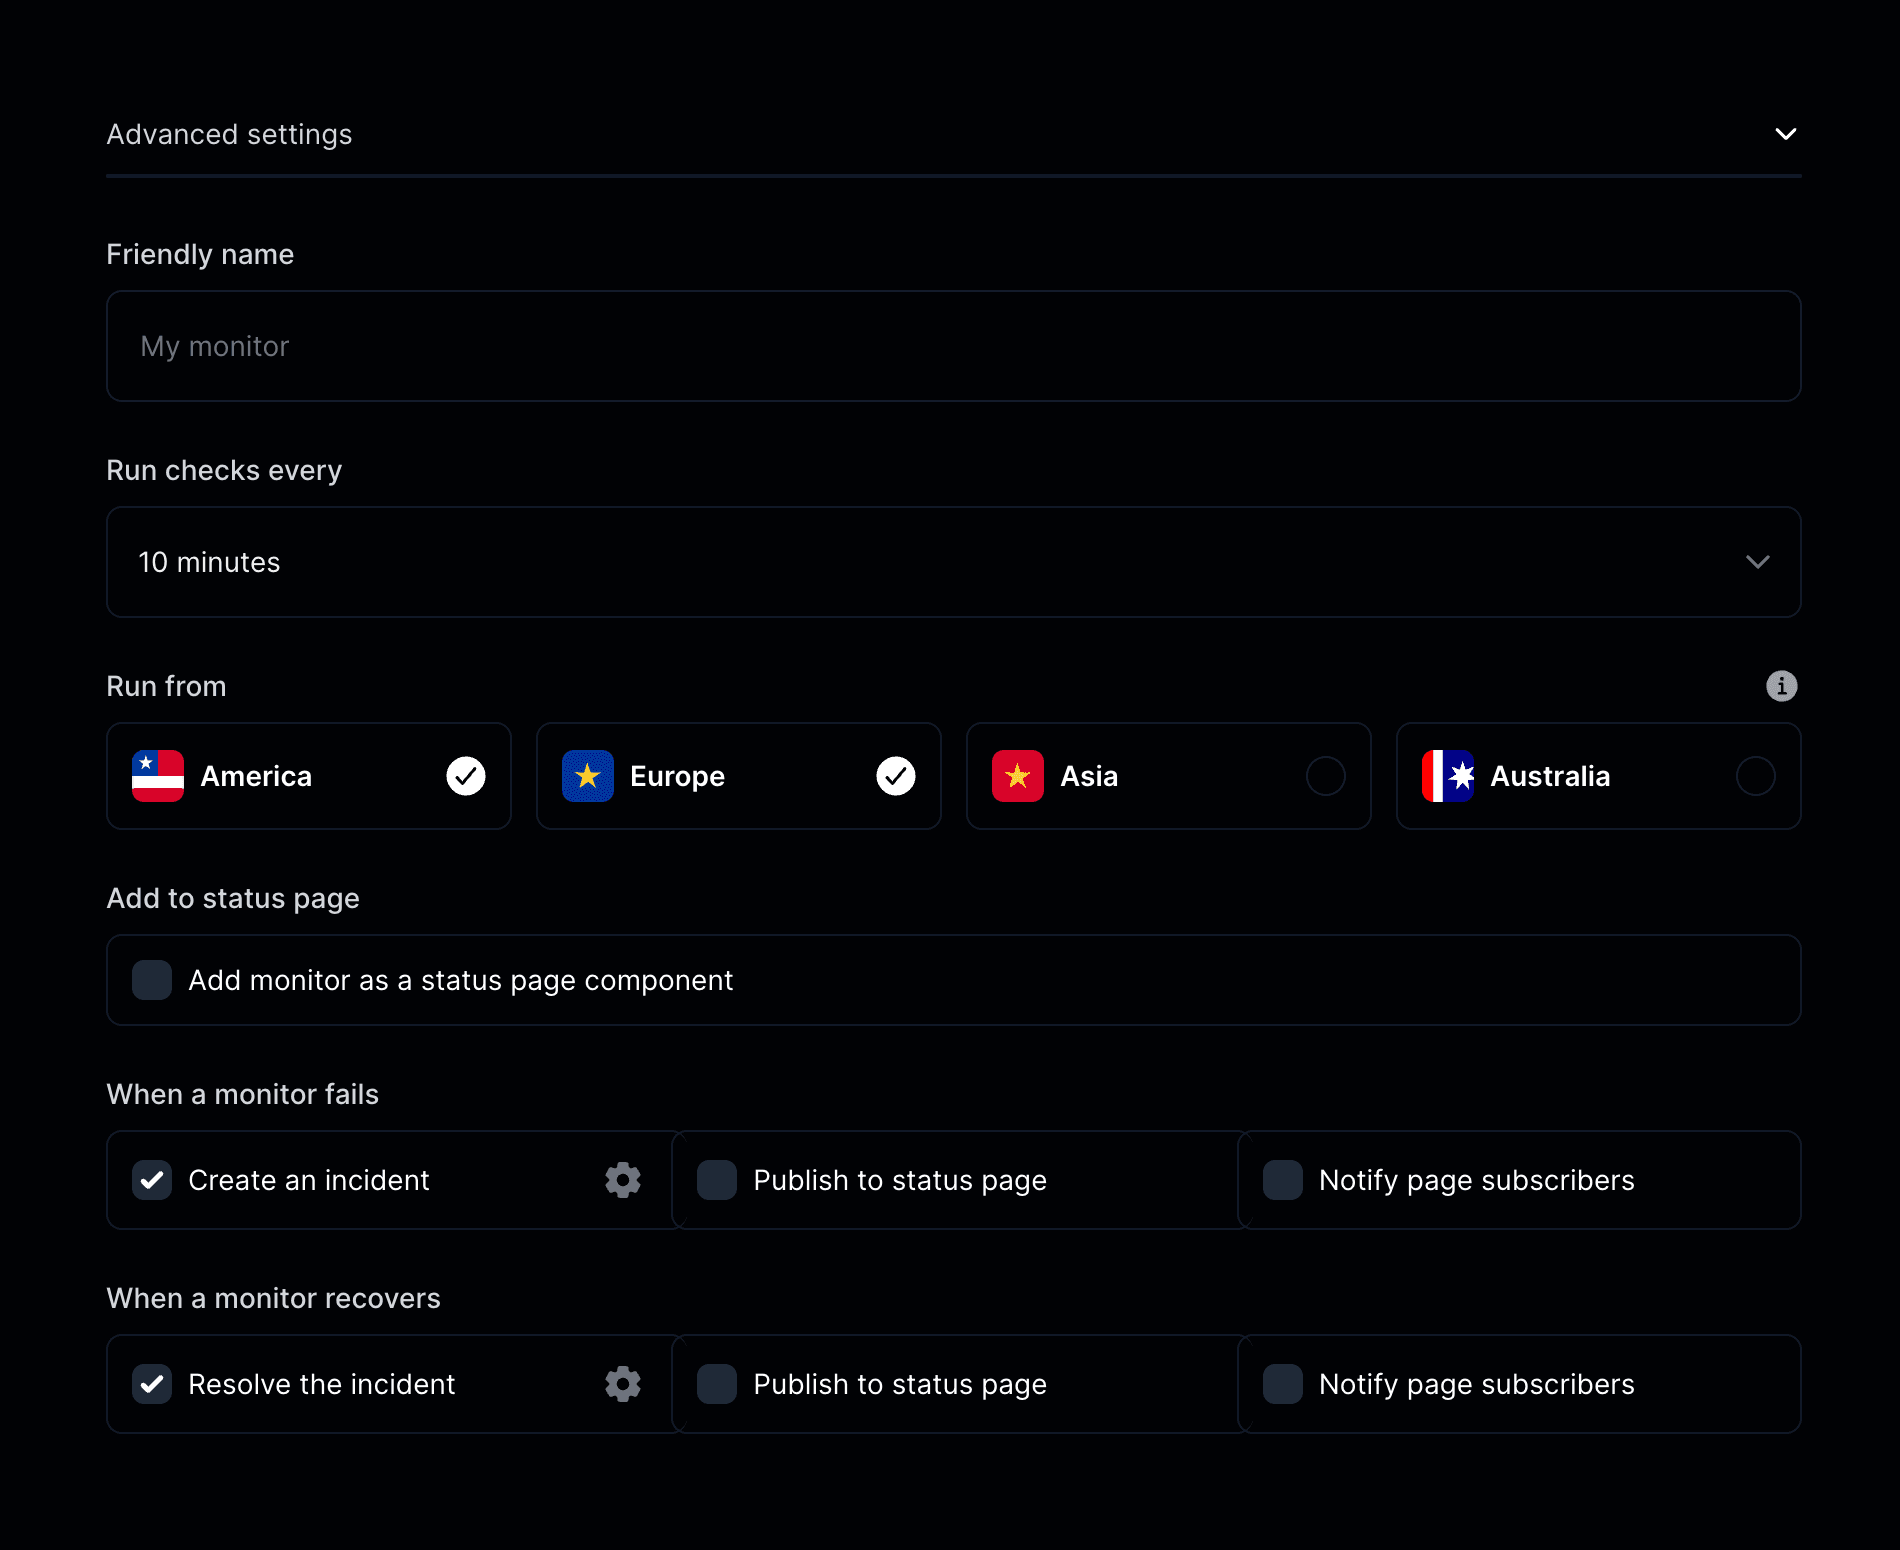
- Friendly name: Assign a descriptive name to your monitor for easier identification.
- Run checks every: Decide how frequently to test the endpoint.
- Run from: Choose testing locations (United States, Canada, Europe, Asia).
- Add to status page: Display API uptime and response statistics publicly.
- When a monitor fails: Initiate an incident, notify subscribers, or publish to your status page.
- When a monitor recovers: Resolve incidents and automatically update your status page.